LED Electroluminescence and Semiconductor Junction Operating Principle

How LEDs Work: Electroluminescence, Materials, and the Light Spectrum

From semiconductor structure to color rendering: how LED light takes shape

Visible light, although perceived as a continuous and unified phenomenon, is actually composed of a multiplicity of wavelengths, each corresponding to a specific stimulation of the visual system. The ability of a light source to ensure natural vision and accurate color rendering depends on its spectral distribution, namely on how luminous energy is distributed within the visible spectrum, ranging approximately from 380 to 780 nanometers.

Not all light sources provide a continuous and balanced coverage of wavelengths. Continuous-spectrum sources, such as sunlight or halogen lamps, produce radiation that spans the entire visible spectrum in a regular manner, allowing faithful color perception and gradual transitions between tones.

Conversely, discontinuous-spectrum sources, such as many LEDs, emit light concentrated in selective spectral bands, determined by the structure of the semiconductor materials and phosphors used. This composition directly influences both the tone of the light (color temperature) and its ability to reproduce colors accurately.

Understanding the nature of the spectrum emitted by a light source is fundamental in contemporary lighting design, because it affects not only perceptual quality and energy efficiency, but also the biological effects related to the interaction between light, the human visual system, and the circadian system.

The design of light, therefore, cannot ignore an in-depth analysis of the emission spectrum, which represents the true qualitative “signature” of every light source.

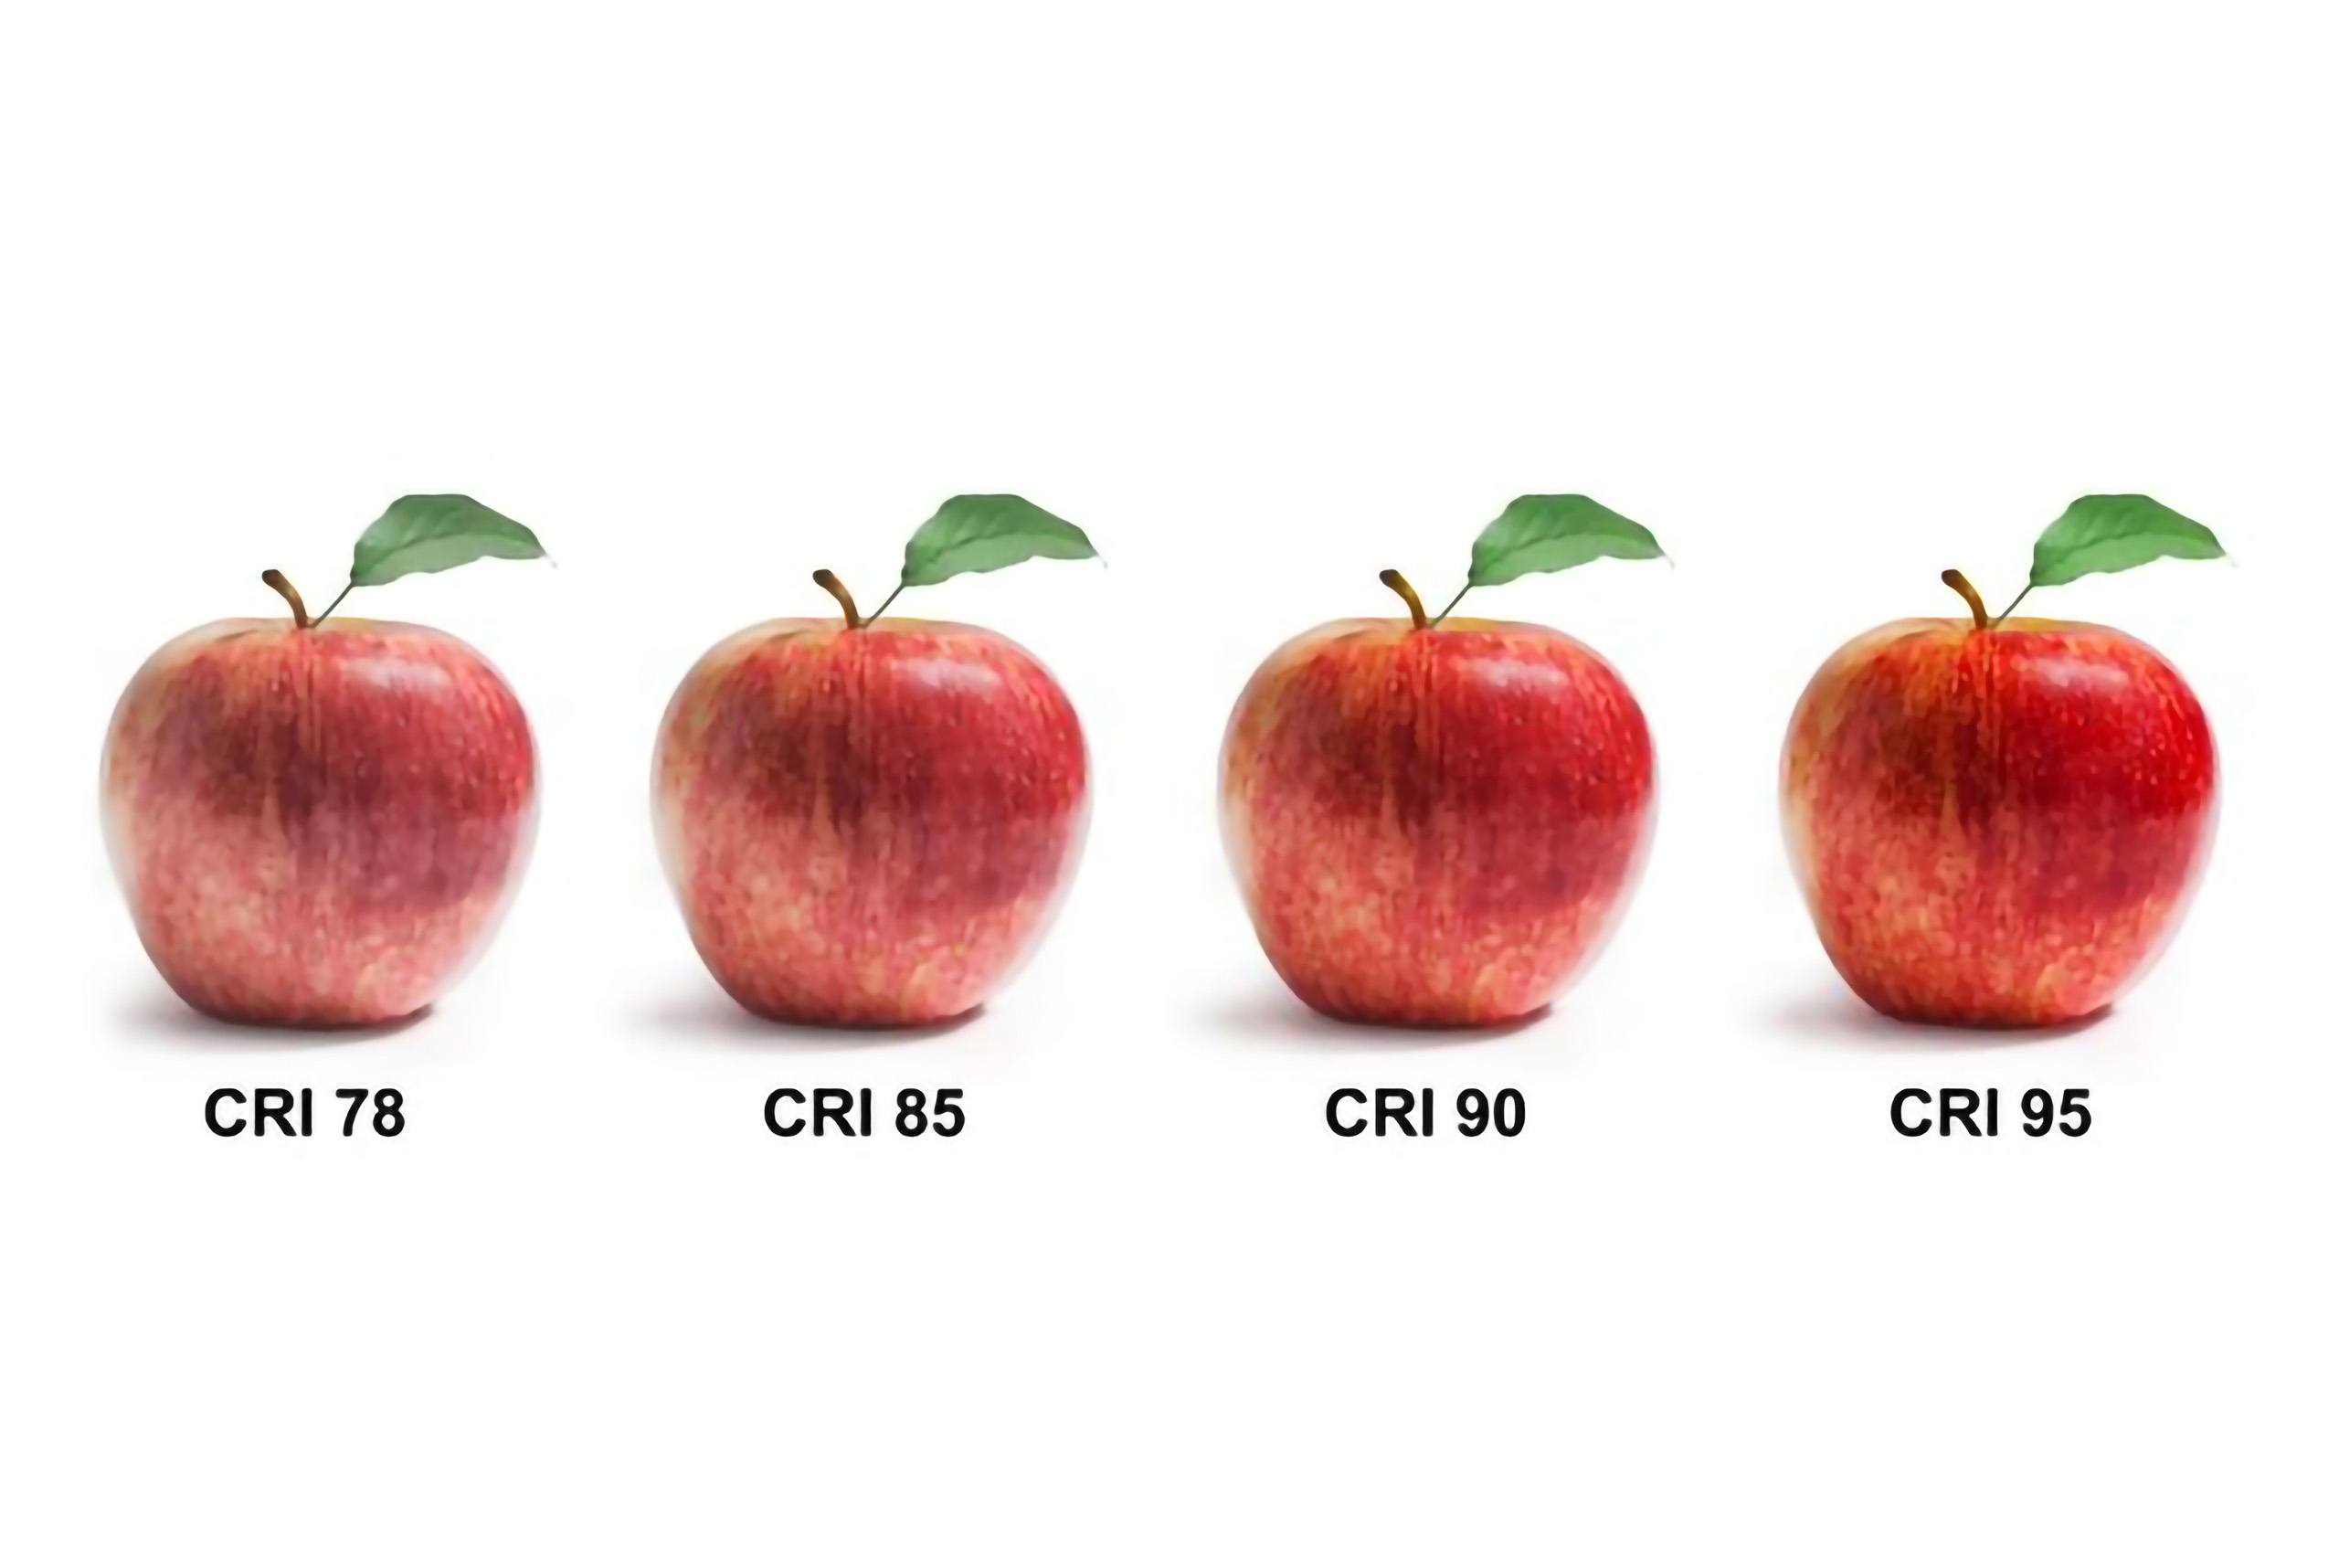
Within today’s landscape — almost entirely dominated by LED lighting technology — it has become essential to move beyond a superficial interpretation of specification-sheet data. While in the past the CRI (Color Rendering Index) represented the primary — and often the only — reference metric for evaluating the color rendering performance of a light source, this is no longer sufficient.

With LEDs, in fact, light is the result of an artificial spectral synthesis whose quality can vary significantly depending on the composition of the semiconductor materials, the phosphors employed, and the spectral emission profile.

The following image shows a comparison between two LED sources with the same CRI value but different emission spectra, highlighting how the same numerical rating may conceal substantial qualitative differences.
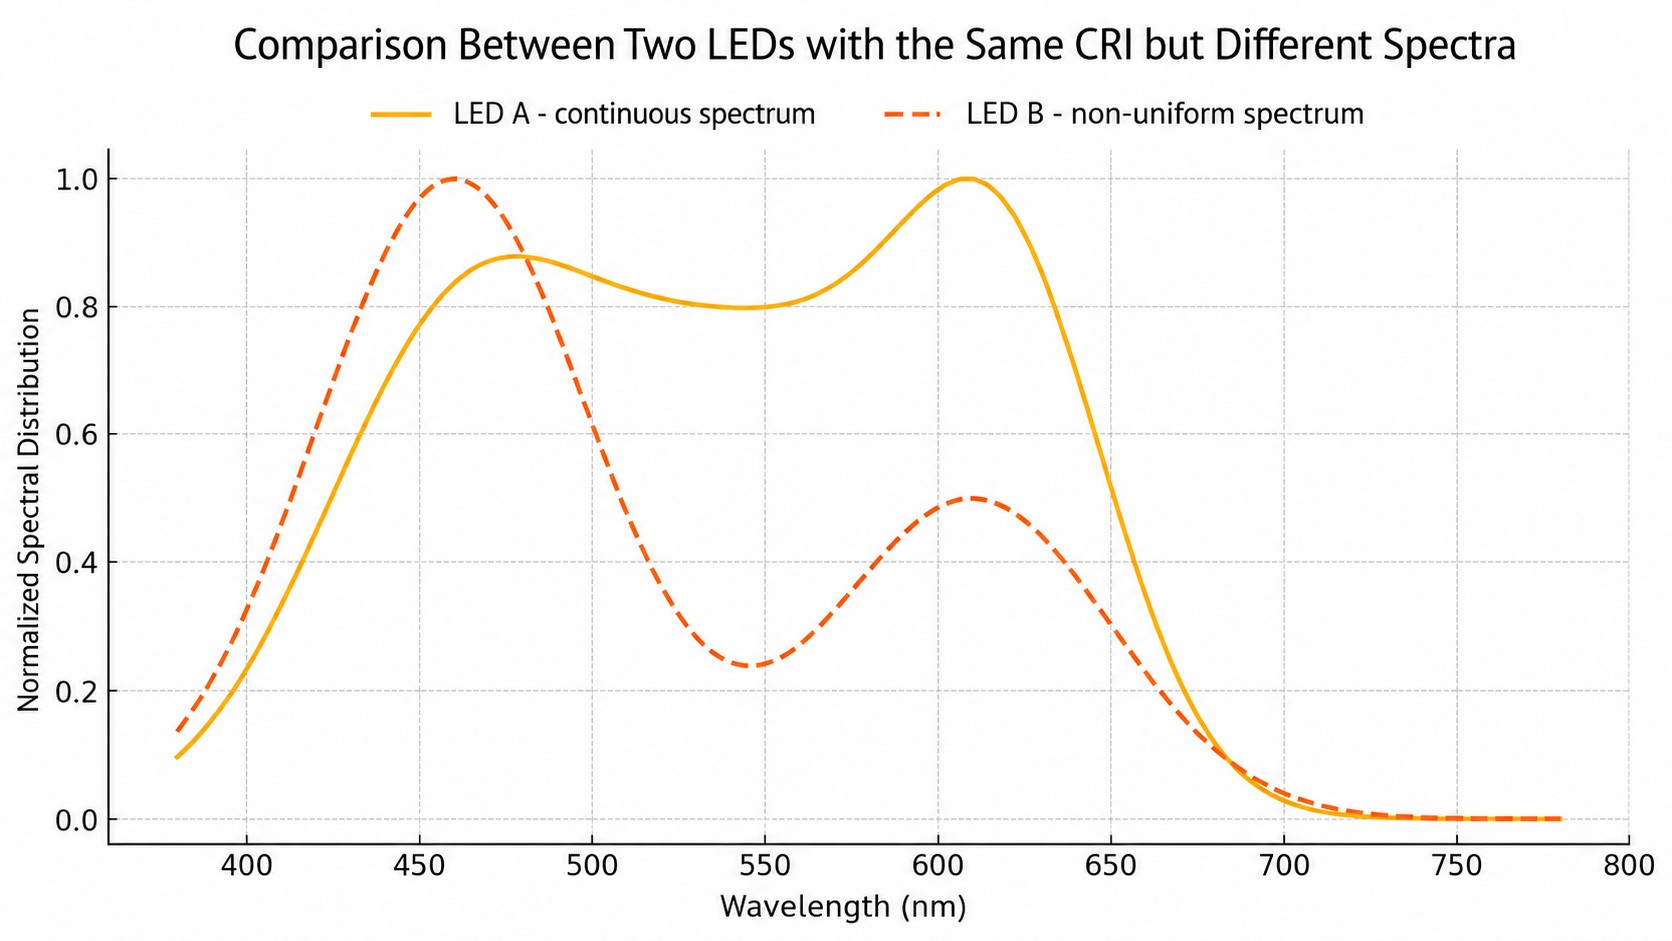
Spectral Power Distribution Comparison of Two LEDs with Identical CRI

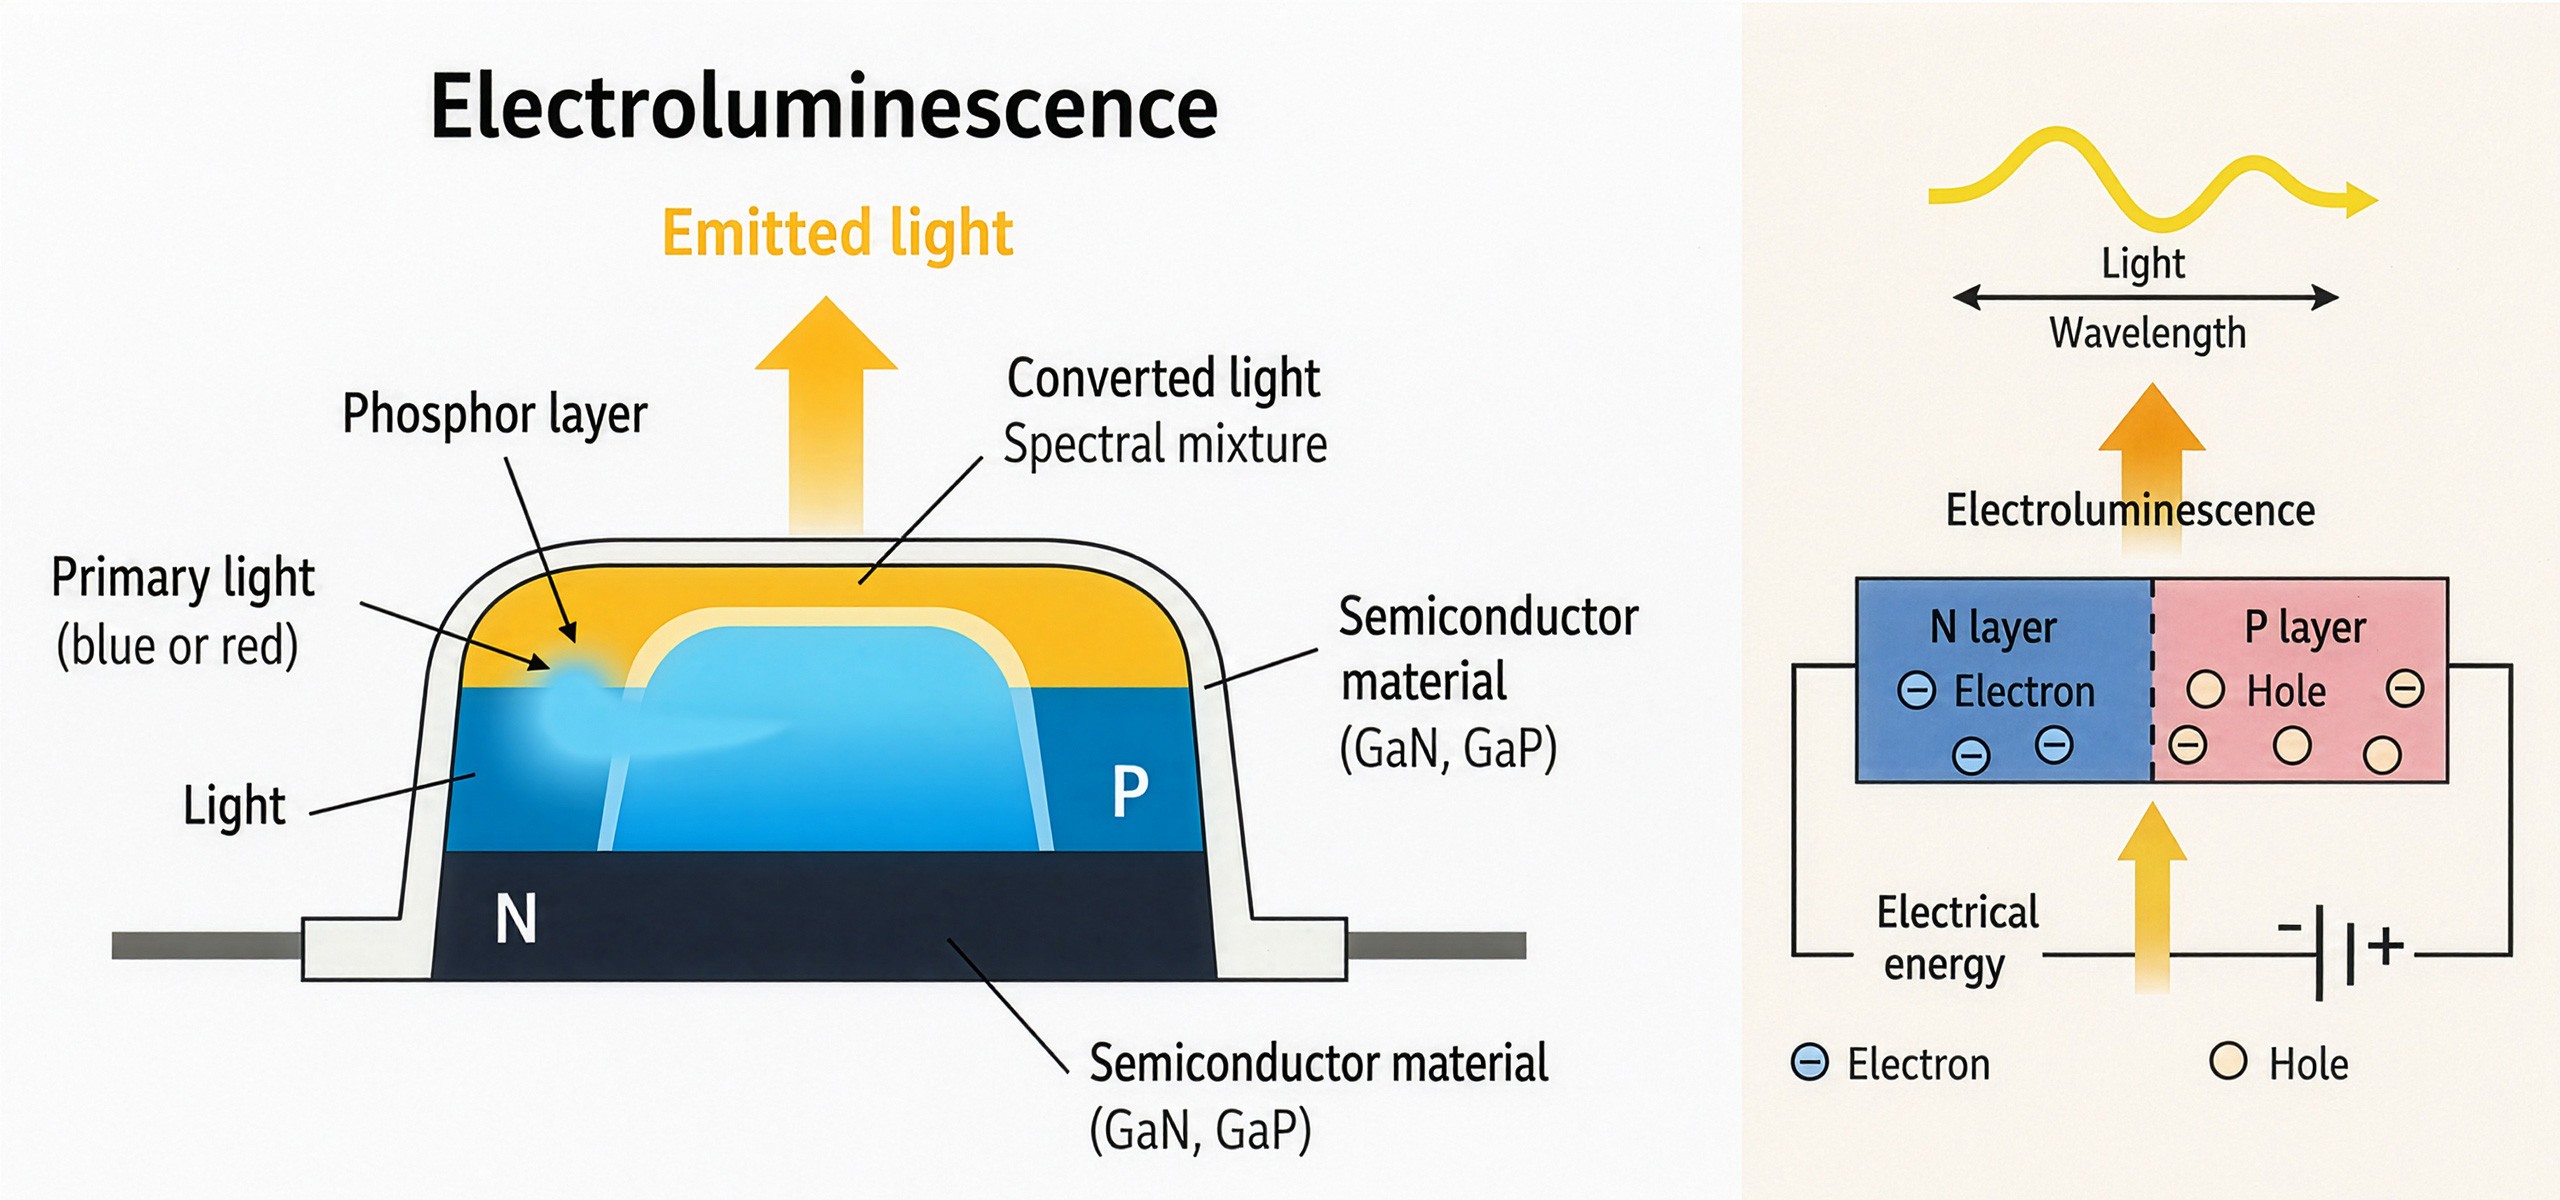
At the core of the light emission process in LEDs lies the phenomenon of electroluminescence, namely the ability of certain semiconductor materials to emit light when crossed by an electric current.

The heart of a LED consists of a P-N junction, created through two regions of a semiconductor material, each doped with elements that modify its electrical conductivity. The N-type layer contains free electrons, while the P-type layer is characterized by holes, namely the absence of electrons.

When a potential difference is applied, electrons from the N layer move toward the P layer, recombining with the holes. This process releases energy in the form of photons, generating light.

The wavelength, and therefore the color of the emitted light, depends on the width of the semiconductor’s band gap: semiconductors with a wide band gap emit light at short wavelengths (blue), whereas semiconductors with a narrower band gap emit at longer wavelengths (red).

The most common semiconductor material used in visible-light LEDs is gallium nitride (GaN) for blue light and gallium phosphide (GaP) for red light.

However, the light produced directly by the P-N junction is not sufficient to obtain a continuous spectrum, which is essential for good color rendering. For this reason, a layer of phosphors is applied above the semiconductor junction. These phosphors are fluorescent materials capable of absorbing part of the primary light and re-emitting it at longer wavelengths, thereby generating a broader spectral distribution.

The final emitted light is therefore the result of the combination between the radiation generated directly by the semiconductor and the radiation converted by the phosphors.

This system makes it possible to obtain different light tones — from warm to cool — and directly affects perceptual quality, spectral uniformity, and the efficiency of the light source.

However, since the resulting spectrum is not continuous but composed of selective peaks, a LED may present spectral gaps capable of compromising color fidelity, especially in sensitive applications such as museums, medical environments, or high-end retail spaces.

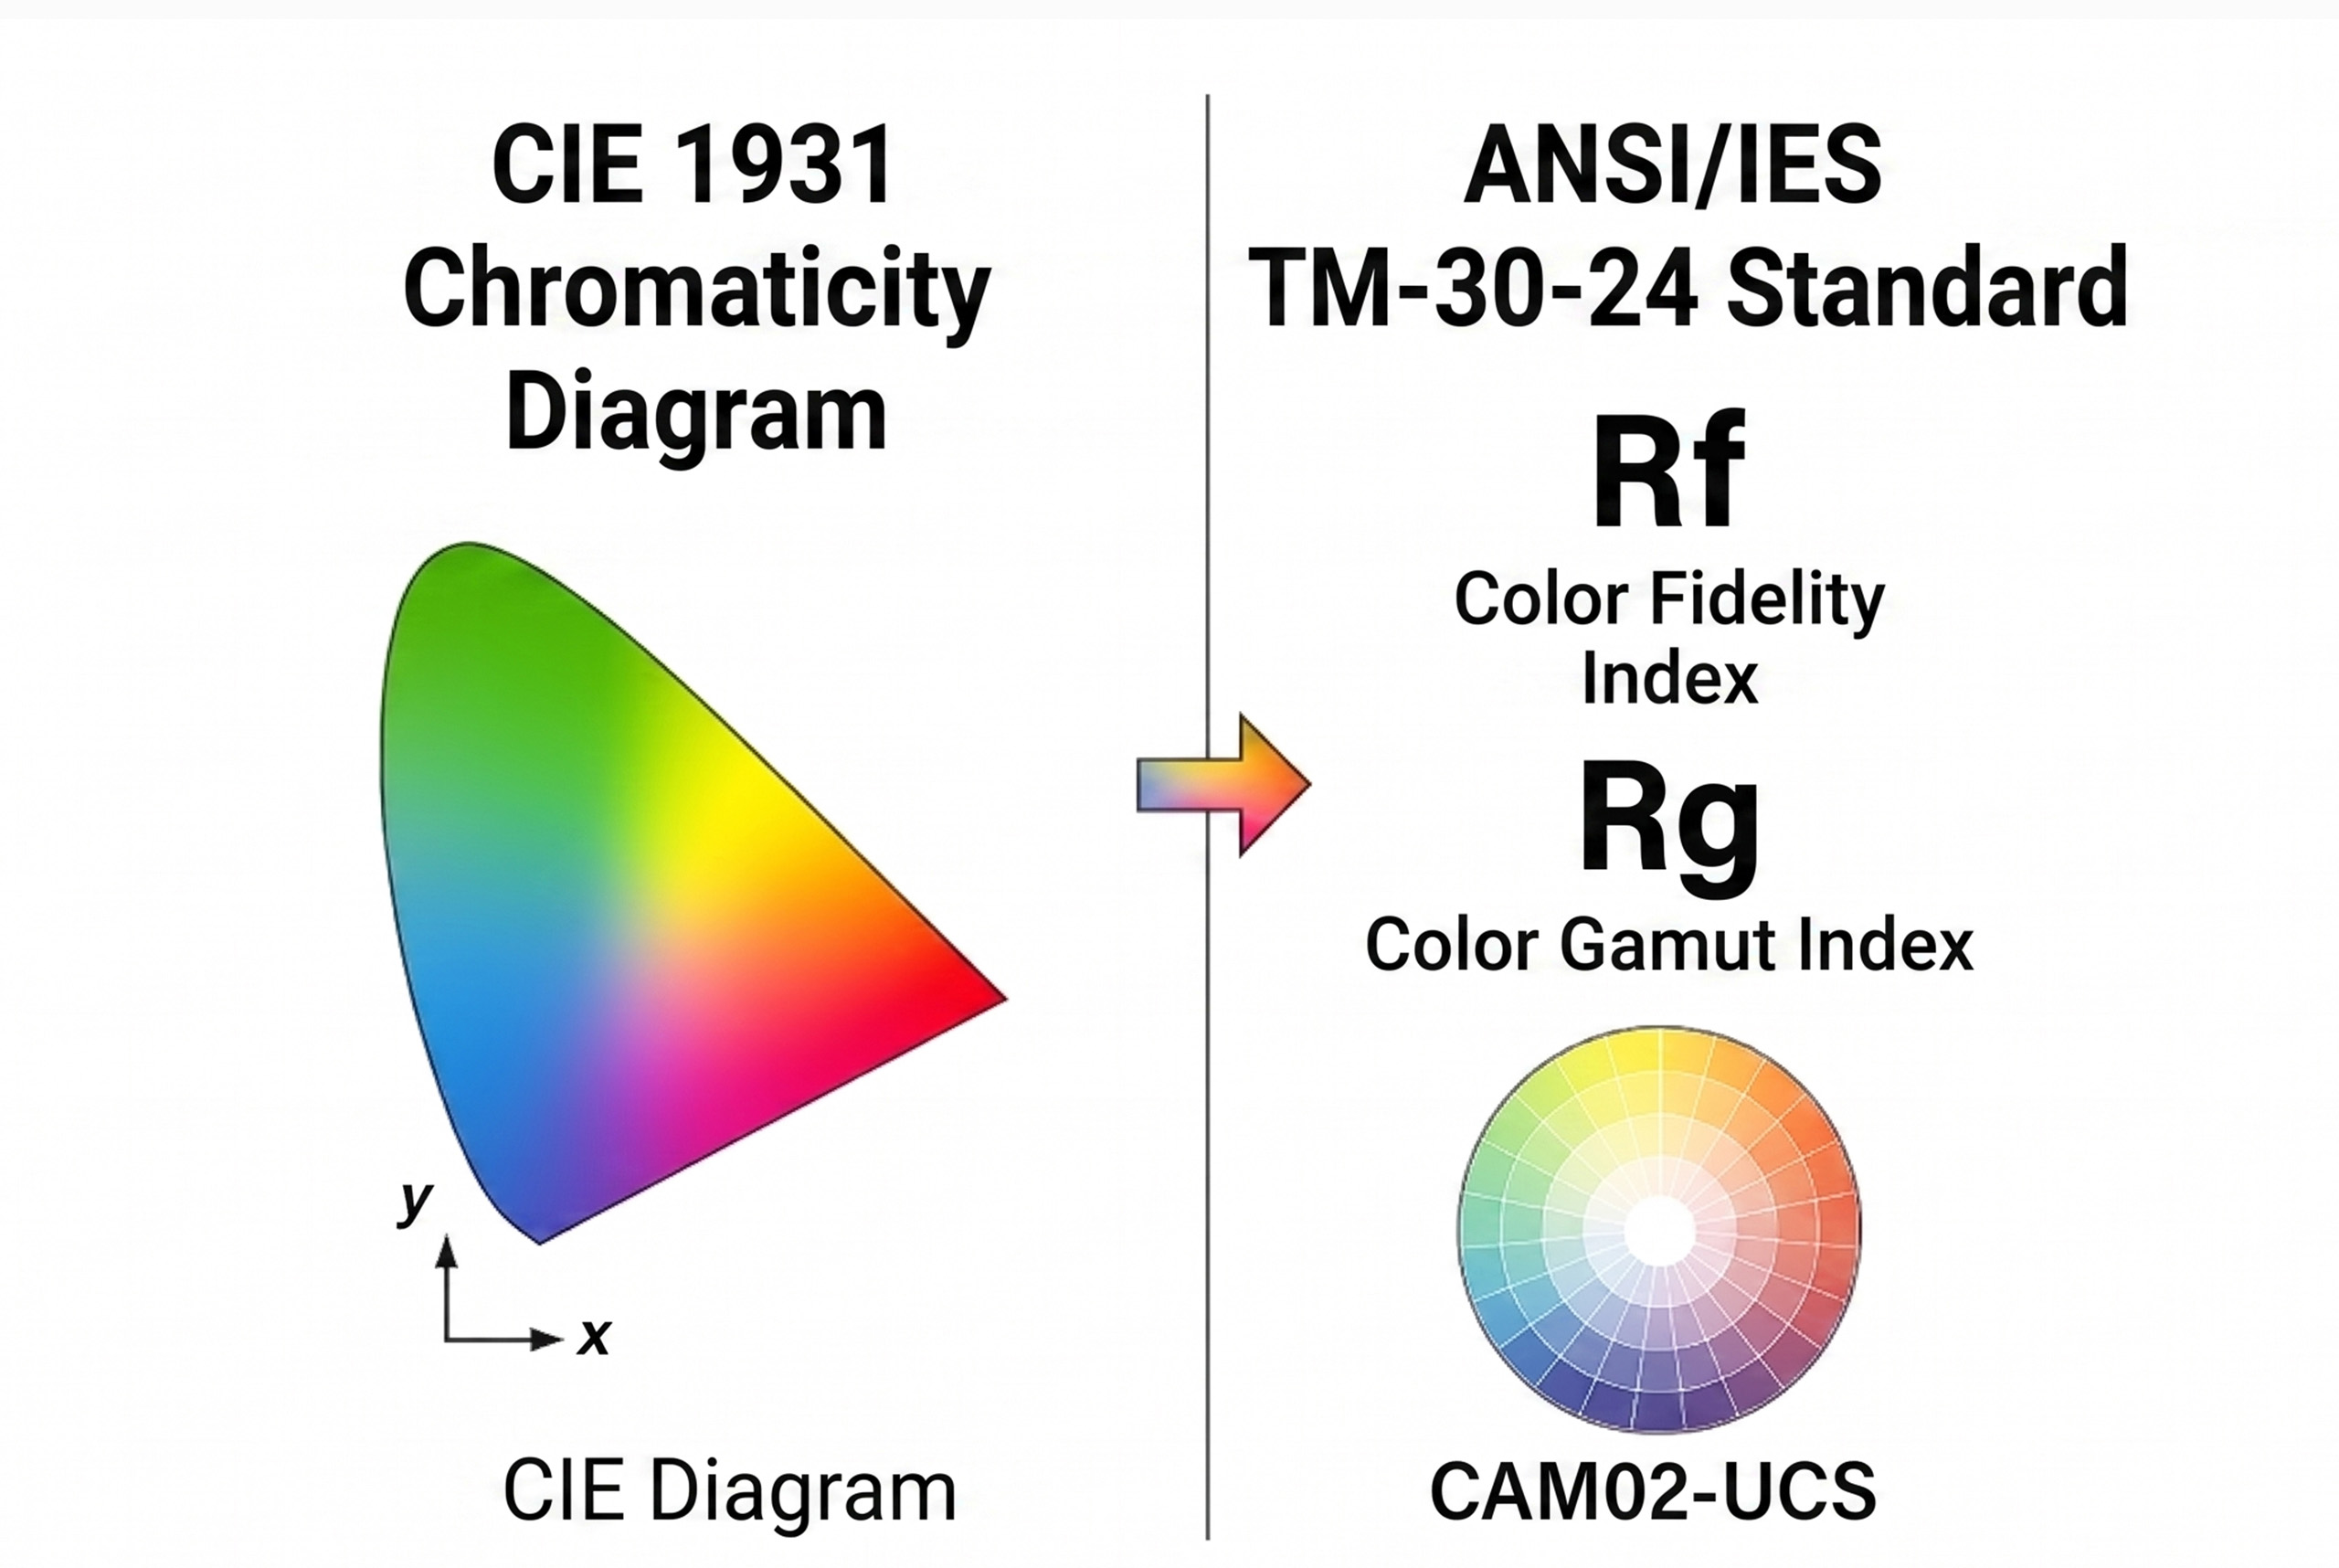
For these reasons, limiting the analysis to a single numerical value such as CRI (or even the more recent Rf, introduced by the IES TM-30-15 standard) is no longer sufficient. Although these indices are useful for a synthetic evaluation of color fidelity, they do not provide complete information regarding color saturation or the spectral composition of the light source.

It is therefore essential to also consider complementary parameters such as Rg (Gamut Index), which describes the expansion or compression of the color gamut, and the SPD (Spectral Power Distribution) curve, which reveals the spectral distribution of the emitted luminous energy.

Only through the combined analysis of fidelity, saturation, and spectral distribution is it possible to comprehensively evaluate the visual and biological quality of the light emitted by a LED source, especially in contexts where visual comfort, color rendering, and circadian balance are central design considerations.
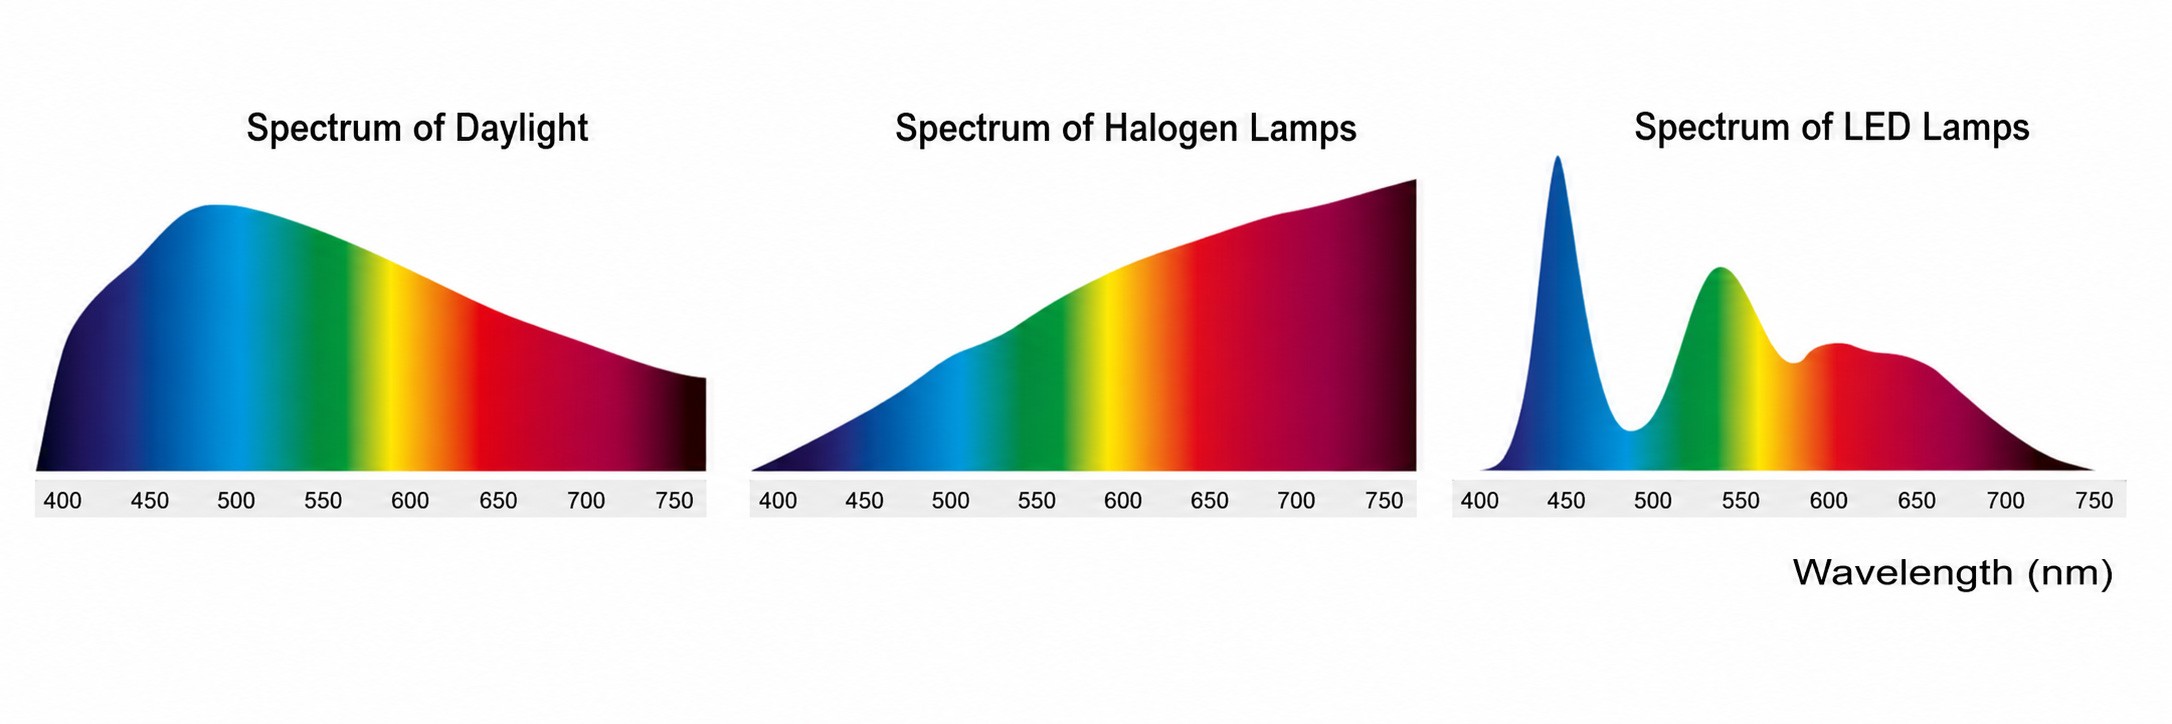
The image shows a comparison between three spectral curves (SPD – Spectral Power Distribution) representing the composition in wavelengths of the visible light emitted by different light sources: daylight, halogen lamps, and LED lamps. Each graph is arranged along the horizontal axis, which represents wavelength in nanometers (nm), from approximately 400 to 750 nm — namely the human visible spectrum, ranging from violet to red.

The daylight spectrum is continuous and balanced, with broad coverage across all wavelengths. It is particularly strong in the blue region (450–480 nm) and remains consistent up to the red region (~700 nm). This spectrum is the most complete and natural, serving as the reference model for color rendering and optimal circadian stimulation, since it includes all components of the visible spectrum.

The spectrum of halogen lamps is also continuous, but it shows an inclination increasing toward longer wavelengths: red components are more pronounced compared to blue ones. This gives halogen light a warm tone (with a red-orange dominance) and good color rendering, but limited melanopic stimulation, because the spectrum contains relatively little blue content.

The spectrum of LED lamps is characterized by a discontinuous spectral distribution, differing significantly from continuous-spectrum sources such as daylight or halogen lamps. The curve typically shows a pronounced peak in the blue region, around 450 nanometers, caused by the direct emission of the blue LED chip. Superimposed on this primary emission is a second, broader region in the green-yellow area, generated by the photonic conversion performed by a layer of fluorescent phosphors, which transform part of the blue light into longer wavelengths. The distribution then extends toward the red components, but with a significant decrease, highlighting the absence of continuous and uniform emission across the entire visible spectrum.

This selective spectral configuration results in a color rendering quality that is not perfectly natural, with localized gaps or excesses in specific color bands, potentially altering color perception compared to natural light. However, thanks to technological advancements and the optimization of semiconductor materials and phosphors, it is now possible to design LEDs with optimized SPD curves for specific applications, balancing luminous efficiency with the desired level of color fidelity.

In summary, the spectral distribution of a light source determines both the perceived tone of light and the color rendering of illuminated objects. A uniform and balanced spectrum enables colors to be reproduced naturally and faithfully, whereas a deficient spectrum — or one characterized by excessive spectral peaks — may alter color perception, influencing both aesthetics and visual comfort.

LED Electroluminescence and Semiconductor Junction Operating Principle

How LEDs Work: Electroluminescence, Materials, and the Light Spectrum

From semiconductor structure to color rendering: how LED light takes shape

Visible light, although perceived as a continuous and unified phenomenon, is actually composed of a multiplicity of wavelengths, each corresponding to a specific stimulation of the visual system. The ability of a light source to ensure natural vision and accurate color rendering depends on its spectral distribution, namely on how luminous energy is distributed within the visible spectrum, ranging approximately from 380 to 780 nanometers.

Not all light sources provide a continuous and balanced coverage of wavelengths. Continuous-spectrum sources, such as sunlight or halogen lamps, produce radiation that spans the entire visible spectrum in a regular manner, allowing faithful color perception and gradual transitions between tones.

Conversely, discontinuous-spectrum sources, such as many LEDs, emit light concentrated in selective spectral bands, determined by the structure of the semiconductor materials and phosphors used. This composition directly influences both the tone of the light (color temperature) and its ability to reproduce colors accurately.

Understanding the nature of the spectrum emitted by a light source is fundamental in contemporary lighting design, because it affects not only perceptual quality and energy efficiency, but also the biological effects related to the interaction between light, the human visual system, and the circadian system.

The design of light, therefore, cannot ignore an in-depth analysis of the emission spectrum, which represents the true qualitative “signature” of every light source.

Within today’s landscape — almost entirely dominated by LED lighting technology — it has become essential to move beyond a superficial interpretation of specification-sheet data. While in the past the CRI (Color Rendering Index) represented the primary — and often the only — reference metric for evaluating the color rendering performance of a light source, this is no longer sufficient.

With LEDs, in fact, light is the result of an artificial spectral synthesis whose quality can vary significantly depending on the composition of the semiconductor materials, the phosphors employed, and the spectral emission profile.

The following image shows a comparison between two LED sources with the same CRI value but different emission spectra, highlighting how the same numerical rating may conceal substantial qualitative differences.

Spectral Power Distribution Comparison of Two LEDs with Identical CRI

At the core of the light emission process in LEDs lies the phenomenon of electroluminescence, namely the ability of certain semiconductor materials to emit light when crossed by an electric current.

The heart of a LED consists of a P-N junction, created through two regions of a semiconductor material, each doped with elements that modify its electrical conductivity. The N-type layer contains free electrons, while the P-type layer is characterized by holes, namely the absence of electrons.

When a potential difference is applied, electrons from the N layer move toward the P layer, recombining with the holes. This process releases energy in the form of photons, generating light.

The wavelength, and therefore the color of the emitted light, depends on the width of the semiconductor’s band gap: semiconductors with a wide band gap emit light at short wavelengths (blue), whereas semiconductors with a narrower band gap emit at longer wavelengths (red).

The most common semiconductor material used in visible-light LEDs is gallium nitride (GaN) for blue light and gallium phosphide (GaP) for red light.

However, the light produced directly by the P-N junction is not sufficient to obtain a continuous spectrum, which is essential for good color rendering. For this reason, a layer of phosphors is applied above the semiconductor junction. These phosphors are fluorescent materials capable of absorbing part of the primary light and re-emitting it at longer wavelengths, thereby generating a broader spectral distribution.

The final emitted light is therefore the result of the combination between the radiation generated directly by the semiconductor and the radiation converted by the phosphors.

This system makes it possible to obtain different light tones — from warm to cool — and directly affects perceptual quality, spectral uniformity, and the efficiency of the light source.

However, since the resulting spectrum is not continuous but composed of selective peaks, a LED may present spectral gaps capable of compromising color fidelity, especially in sensitive applications such as museums, medical environments, or high-end retail spaces.

For these reasons, limiting the analysis to a single numerical value such as CRI (or even the more recent Rf, introduced by the IES TM-30-15 standard) is no longer sufficient. Although these indices are useful for a synthetic evaluation of color fidelity, they do not provide complete information regarding color saturation or the spectral composition of the light source.

It is therefore essential to also consider complementary parameters such as Rg (Gamut Index), which describes the expansion or compression of the color gamut, and the SPD (Spectral Power Distribution) curve, which reveals the spectral distribution of the emitted luminous energy.

Only through the combined analysis of fidelity, saturation, and spectral distribution is it possible to comprehensively evaluate the visual and biological quality of the light emitted by a LED source, especially in contexts where visual comfort, color rendering, and circadian balance are central design considerations.

The image shows a comparison between three spectral curves (SPD – Spectral Power Distribution) representing the composition in wavelengths of the visible light emitted by different light sources: daylight, halogen lamps, and LED lamps. Each graph is arranged along the horizontal axis, which represents wavelength in nanometers (nm), from approximately 400 to 750 nm — namely the human visible spectrum, ranging from violet to red.

The daylight spectrum is continuous and balanced, with broad coverage across all wavelengths. It is particularly strong in the blue region (450–480 nm) and remains consistent up to the red region (~700 nm). This spectrum is the most complete and natural, serving as the reference model for color rendering and optimal circadian stimulation, since it includes all components of the visible spectrum.

The spectrum of halogen lamps is also continuous, but it shows an inclination increasing toward longer wavelengths: red components are more pronounced compared to blue ones. This gives halogen light a warm tone (with a red-orange dominance) and good color rendering, but limited melanopic stimulation, because the spectrum contains relatively little blue content.

The spectrum of LED lamps is characterized by a discontinuous spectral distribution, differing significantly from continuous-spectrum sources such as daylight or halogen lamps. The curve typically shows a pronounced peak in the blue region, around 450 nanometers, caused by the direct emission of the blue LED chip. Superimposed on this primary emission is a second, broader region in the green-yellow area, generated by the photonic conversion performed by a layer of fluorescent phosphors, which transform part of the blue light into longer wavelengths. The distribution then extends toward the red components, but with a significant decrease, highlighting the absence of continuous and uniform emission across the entire visible spectrum.

This selective spectral configuration results in a color rendering quality that is not perfectly natural, with localized gaps or excesses in specific color bands, potentially altering color perception compared to natural light. However, thanks to technological advancements and the optimization of semiconductor materials and phosphors, it is now possible to design LEDs with optimized SPD curves for specific applications, balancing luminous efficiency with the desired level of color fidelity.

In summary, the spectral distribution of a light source determines both the perceived tone of light and the color rendering of illuminated objects. A uniform and balanced spectrum enables colors to be reproduced naturally and faithfully, whereas a deficient spectrum — or one characterized by excessive spectral peaks — may alter color perception, influencing both aesthetics and visual comfort.
Other Lighting Post

Other Lighting Post

This section brings together a comprehensive body of theoretical, scientific, and design insights into the theory of light applied to lighting design, systematically addressing the complex relationship between light, visual perception, and spatial design. The content develops the physical foundations of light, an understanding of the mechanisms of human vision, the differences between photopic and melanopic illuminance, and the biological impact of artificial light, integrating advanced metrics and contemporary interpretation criteria.

The page also explores the functioning of LED sources, the spectral and perceptual implications of solid-state light, the evolution of color rendering criteria, and the growing role of light as an informational and perceptual system, capable of influencing behavior, comfort, and the quality of spatial experience.

Ample space is dedicated to the relevant regulatory and technical framework, international standards, sustainability protocols, and control systems, understood as essential tools for rigorous, measurable, and consistent design.

Overall, the section provides a vision of the theory of light as the cultural and operational basis of lighting design, in which scientific knowledge, perceptual awareness, and design method converge to guide the lighting designer in the construction of balanced, legible, and qualitatively significant spaces.

This section brings together a comprehensive body of theoretical, scientific, and design insights into the theory of light applied to lighting design, systematically addressing the complex relationship between light, visual perception, and spatial design. The content develops the physical foundations of light, an understanding of the mechanisms of human vision, the differences between photopic and melanopic illuminance, and the biological impact of artificial light, integrating advanced metrics and contemporary interpretation criteria.

The page also explores the functioning of LED sources, the spectral and perceptual implications of solid-state light, the evolution of color rendering criteria, and the growing role of light as an informational and perceptual system, capable of influencing behavior, comfort, and the quality of spatial experience.

Ample space is dedicated to the relevant regulatory and technical framework, international standards, sustainability protocols, and control systems, understood as essential tools for rigorous, measurable, and consistent design.

Overall, the section provides a vision of the theory of light as the cultural and operational basis of lighting design, in which scientific knowledge, perceptual awareness, and design method converge to guide the lighting designer in the construction of balanced, legible, and qualitatively significant spaces.

Beyond the CRI: The New Era of Colour Rendering in Architectural Light How Rf and Rg redefine color rendering for a light designed on the visual experience Continuing the analysis…
Dalla-Percezione-alla-Funzione-L’Influenza-della-Temperatura-di-Colore-sullo-Spazio-Illuminato-copertina
From Perception to Function: The Influence of Color Temperature on Illuminated Space Color temperature as a perceptual language: designing atmospheres, guiding vision and shaping space After exploring the scientific bases,…
La-luce-che-informa-rivoluzione-o-rischio-per-il-futuro-dell’illuminazione-copertina-eng
The Light That Informs: Revolution or Risk for the Future of Lighting? μPLS and microLED between innovation and danger of visual excess Historically, we are used to thinking of artificial…
Differences Between Traditional LEDs and μPLS by Nichia: From the Car to the City, the Path of the Digital Light Engine From road safety to smart city: μPLS and high-resolution…
The Silent Revolution of LEDs: The Crisis of Seeing in the Age of Solid-State Lighting From Daylight to Electrical Simulation, Digital Lighting Redefines Perception, Dissolving the Link Between Visual Experience…
Technical Regulations for Electrical Systems and Lighting in Yachts Electrical safety, visual comfort and ship compliance according to IEC, ISO, CEI, RINA and DNV standards. Electrical Safety and Wiring in…
Main Regulatory Bodies and Guidelines in Lighting Technology A comprehensive framework on technical standards, international collaborations and key documents for designing light according to scientific and performance criteria. CIE (International…
Standard-Lighting-Measurements-(LM)-dell’IES-Codici,-Struttura-e-Implicazioni-Progettuali_Copertina-eng
IES Standard Lighting Measurements (LM): Codes, Structure, and Design Implications Technical guide to LM standards for measuring the photometric, chromatic, and electrical performance of LEDs, modules, and luminaires. After having…
Standard-Technical-Memoranda-(TM)-dell’IES-Codici,-Struttura-e-Implicazioni-Progettuali_Copertina-eng
IES Standard Technical Memoranda (TM): Codes, Structure, and Design Implications A technical guide to the use and interpretation of TM documents in lighting design The following insight is dedicated to…
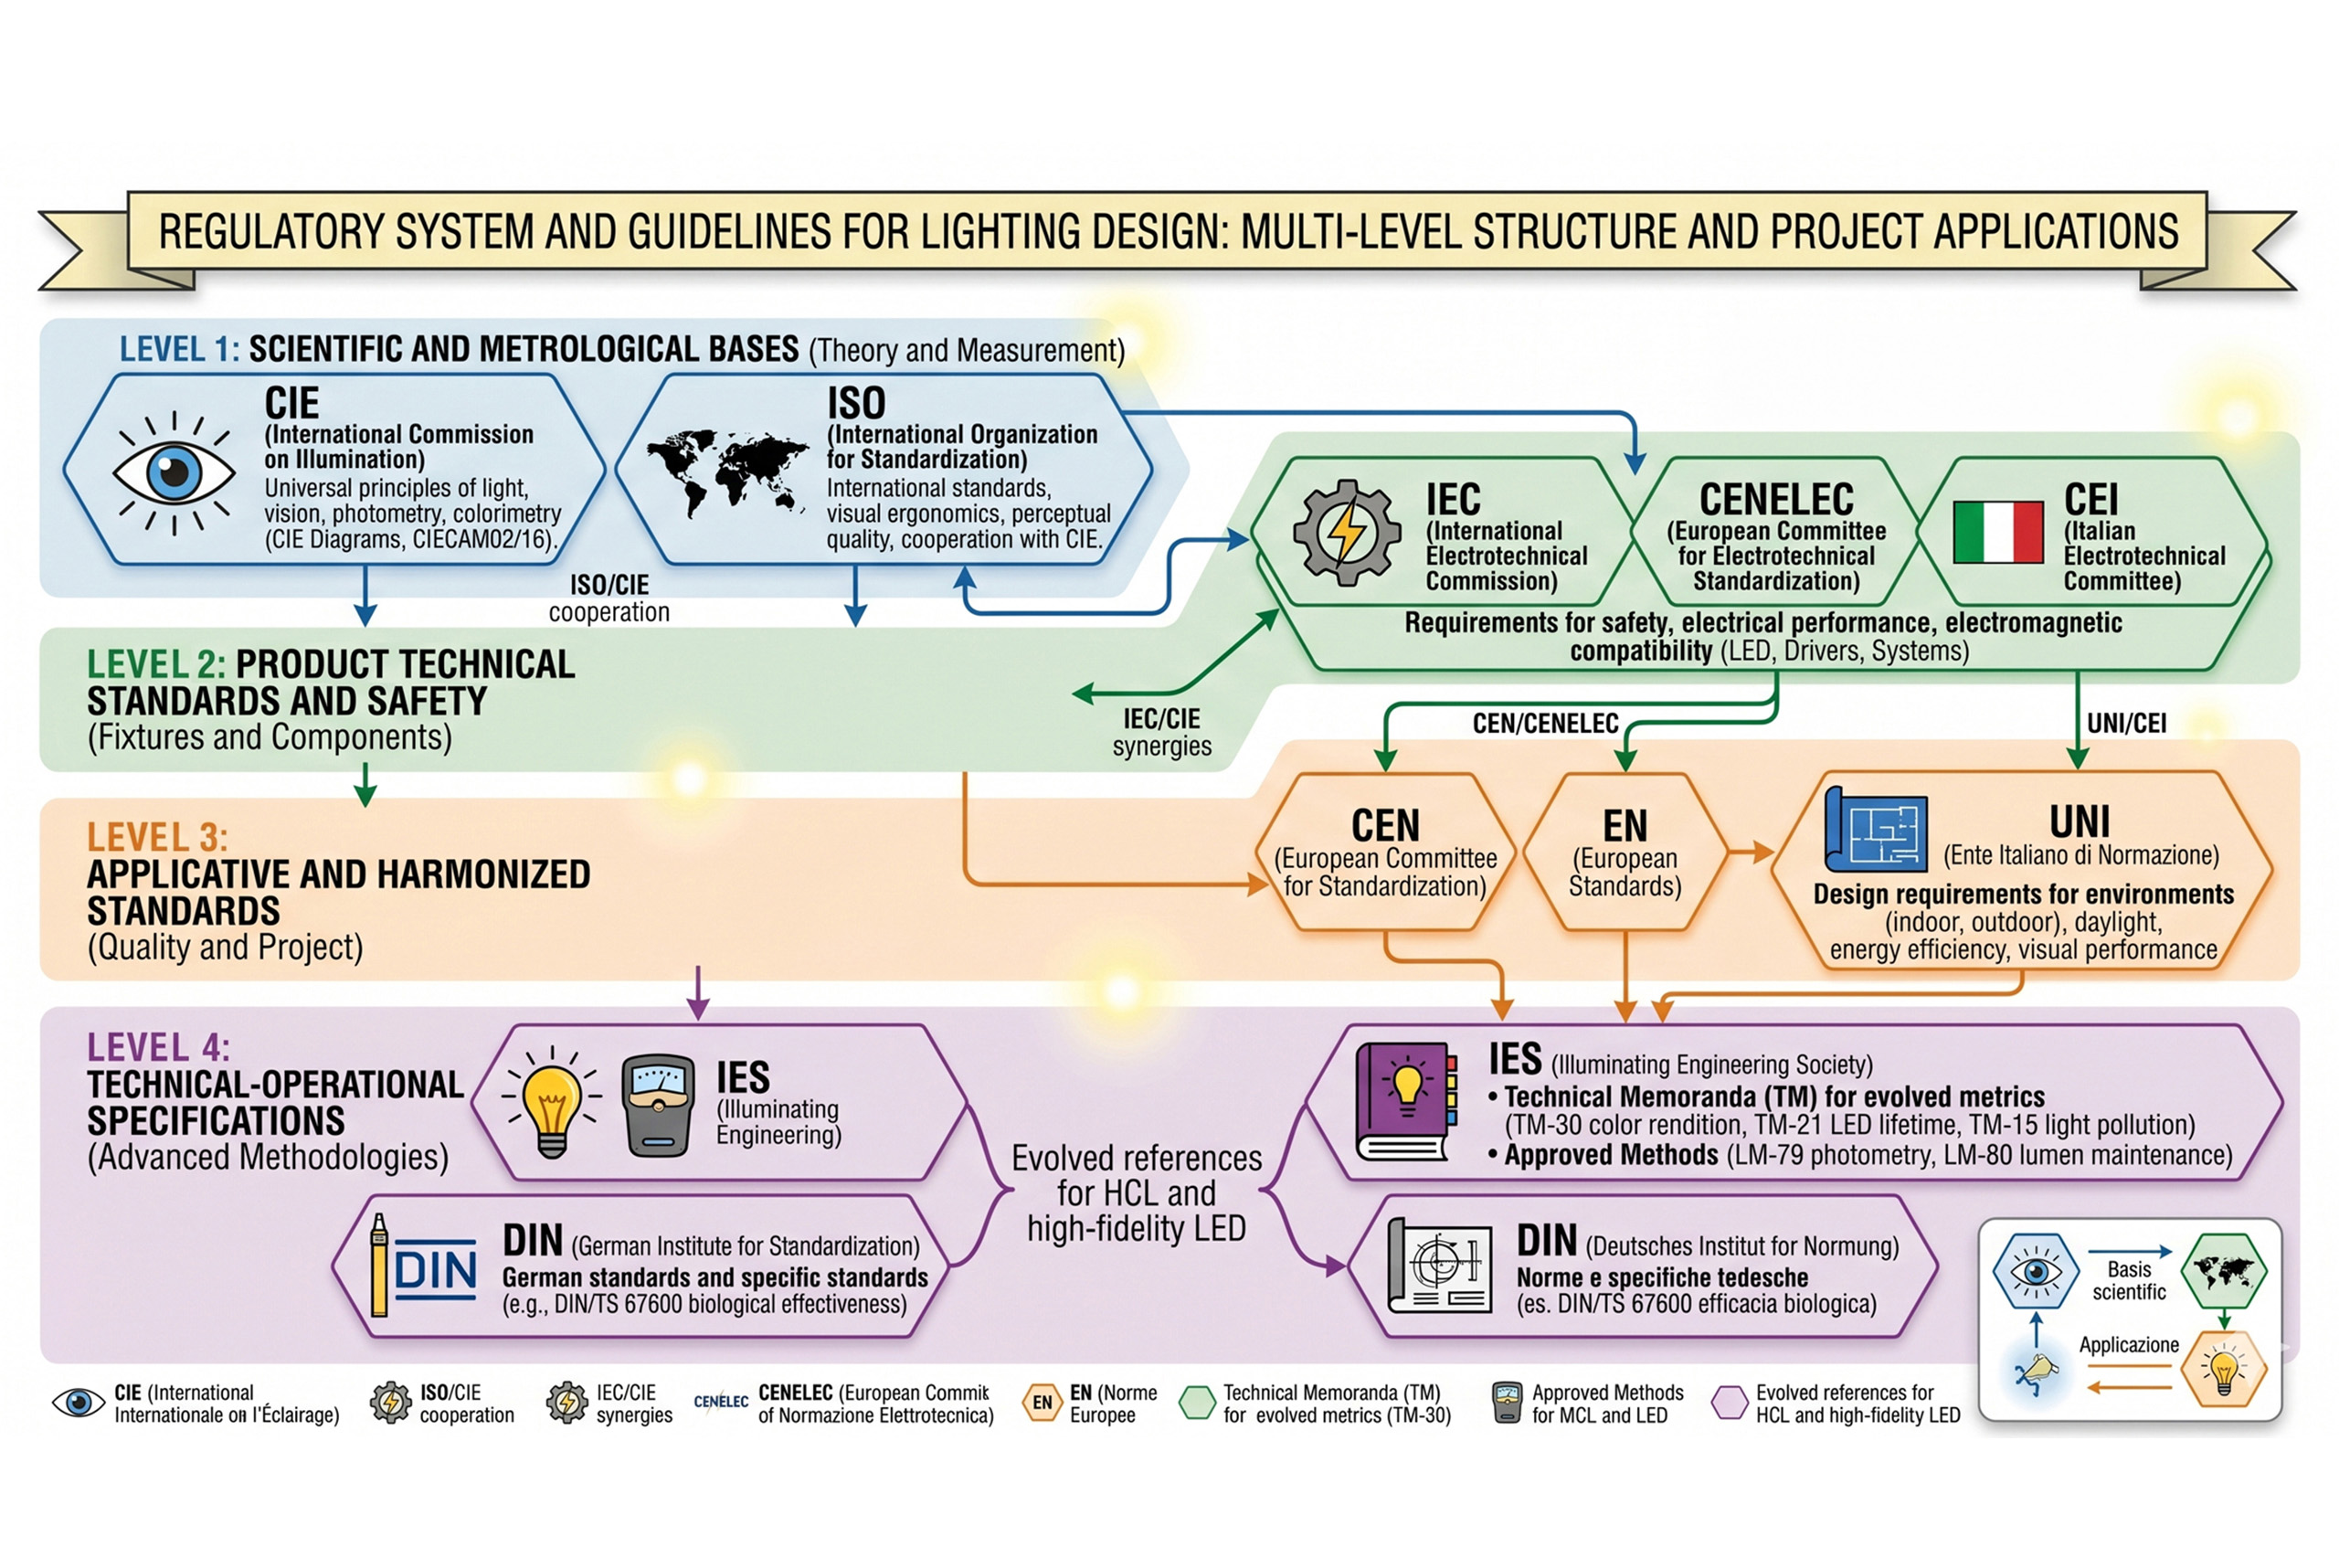
Authoritative Standards and Guidelines in Lighting Technology: Multilevel Structure and Design Applications A complex regulatory system for designing light with technical rigor and application coherence The evolution of light sources…
With the advent of LED sources, can we define the 1931 CIE diagram as obsolete? Formally no, but practically yes, in many application contexts. Now that we have understood how…
digital light and perceived thresholds - cover
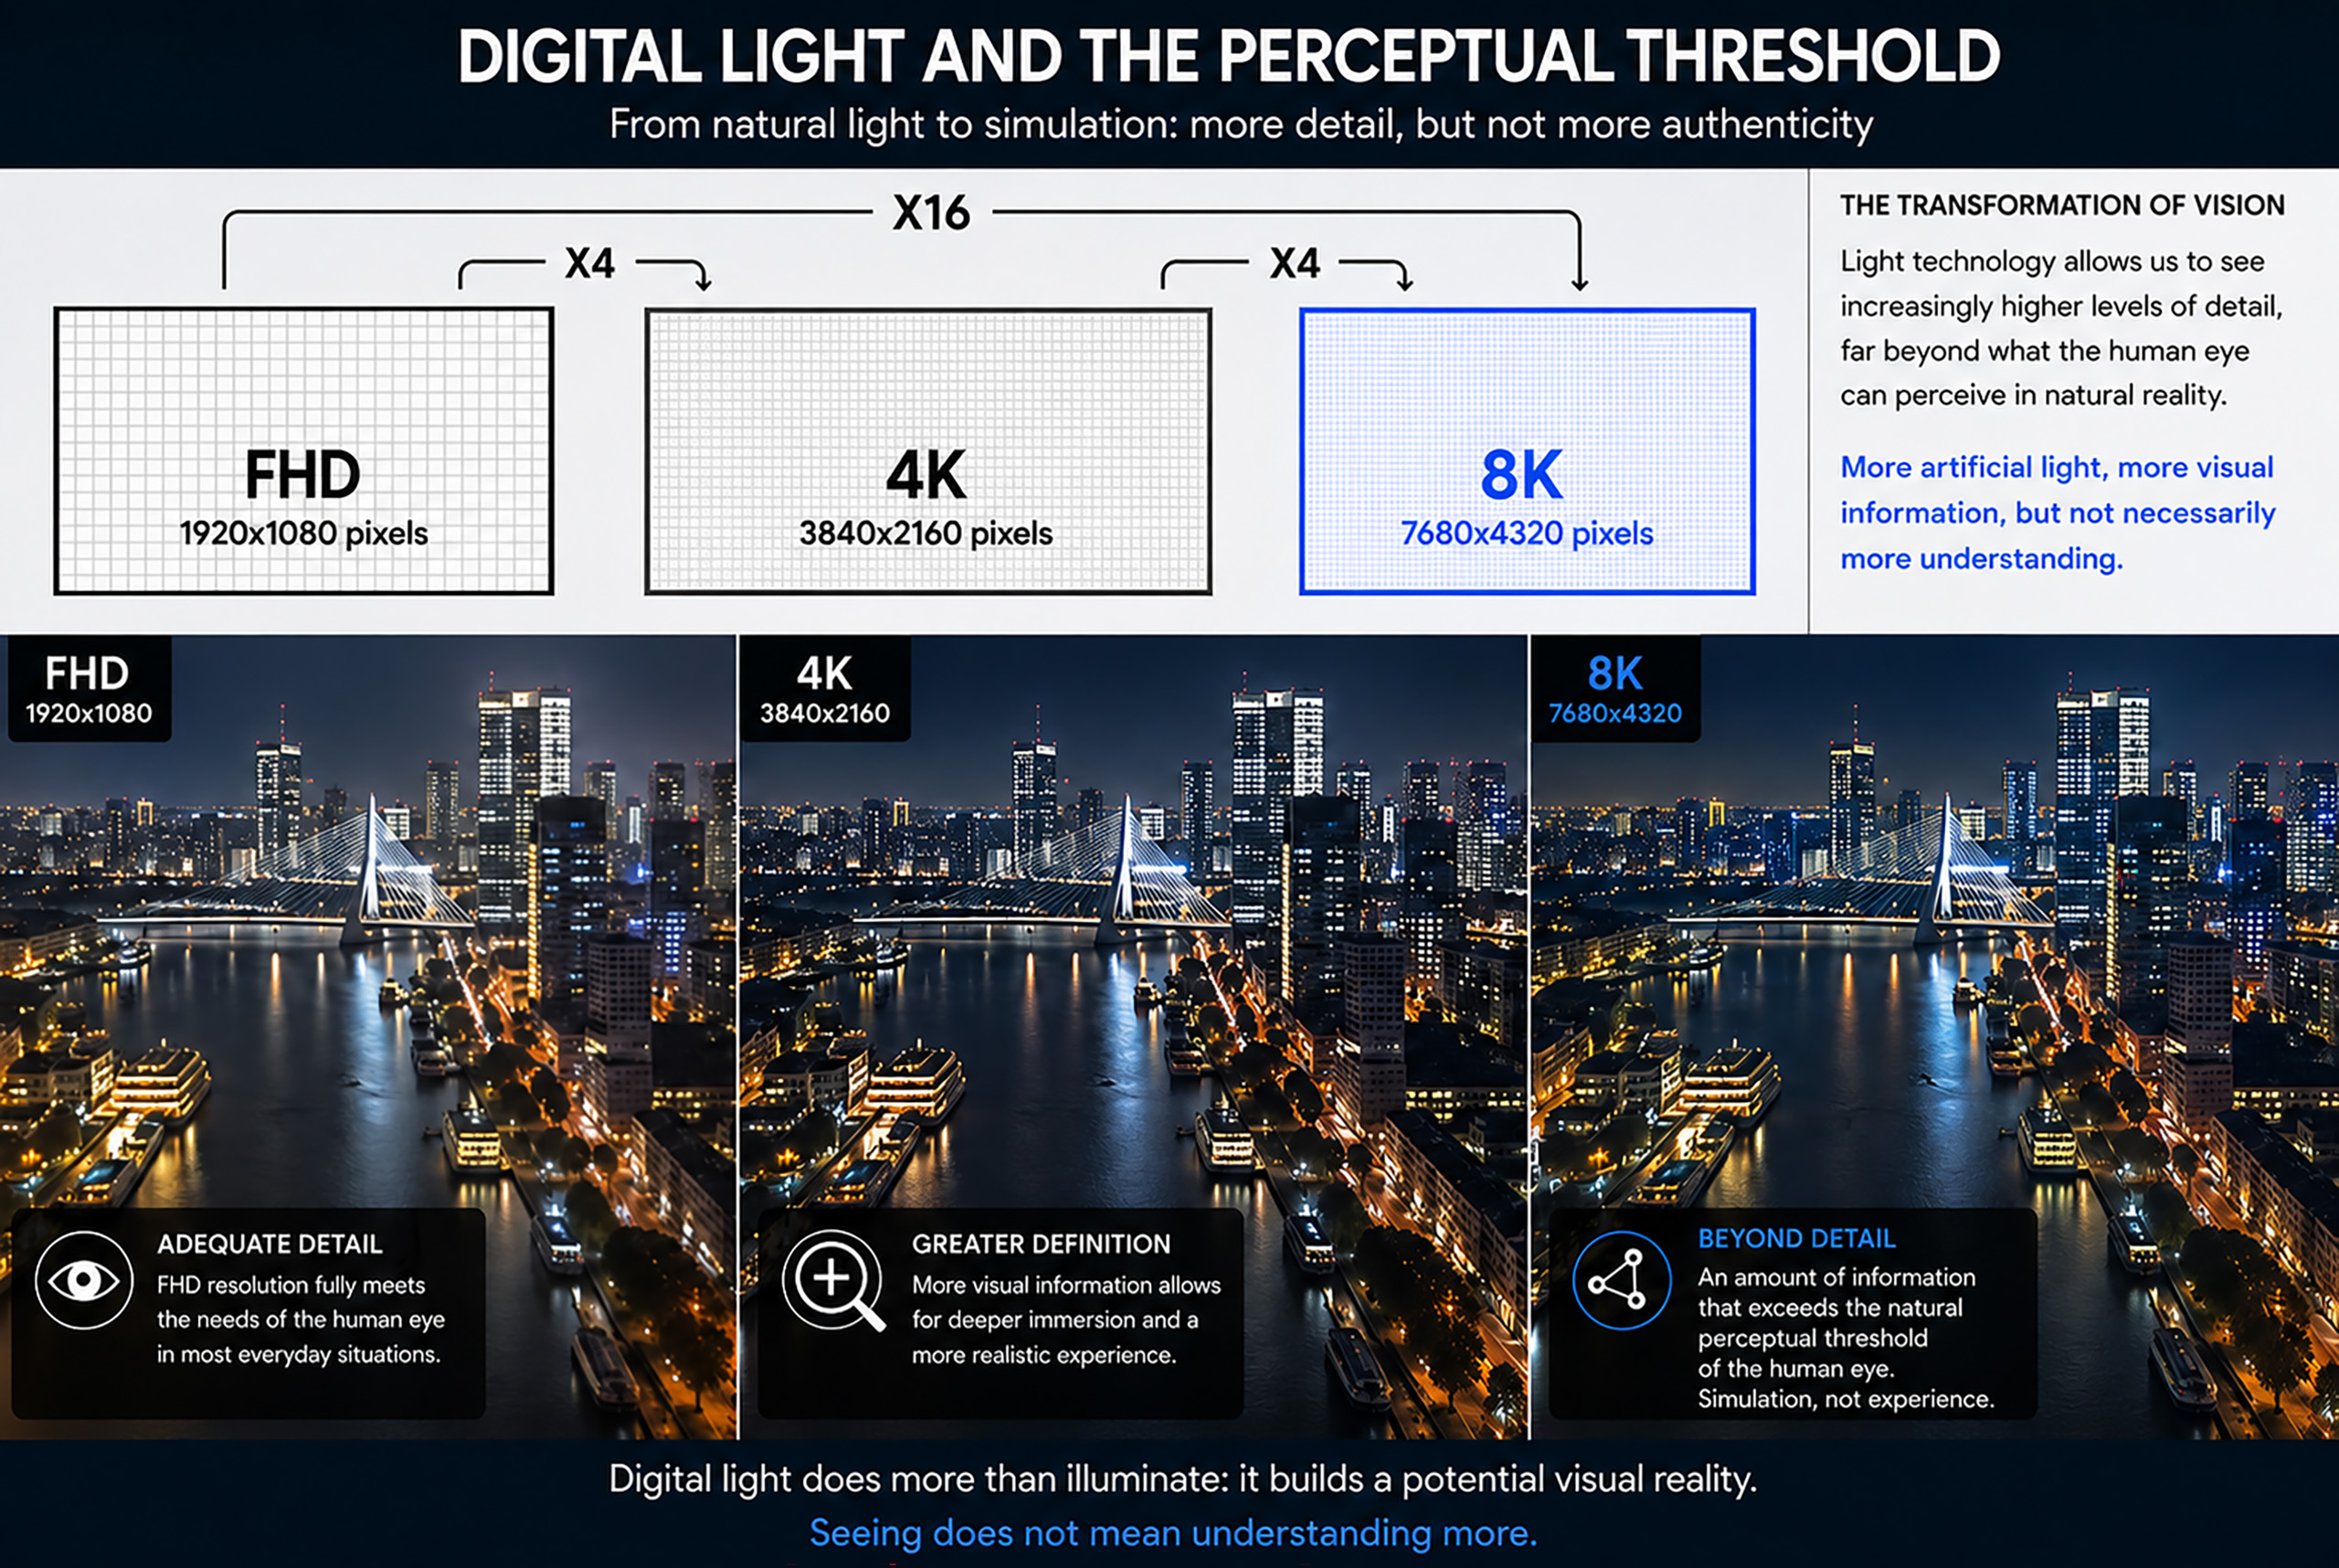
Digital Lighting and Visual Perception: the Dissolution of the See/Understand Relationship How electric light is changing the relationship between seeing, experiencing, and understanding the world In today's era of digital…
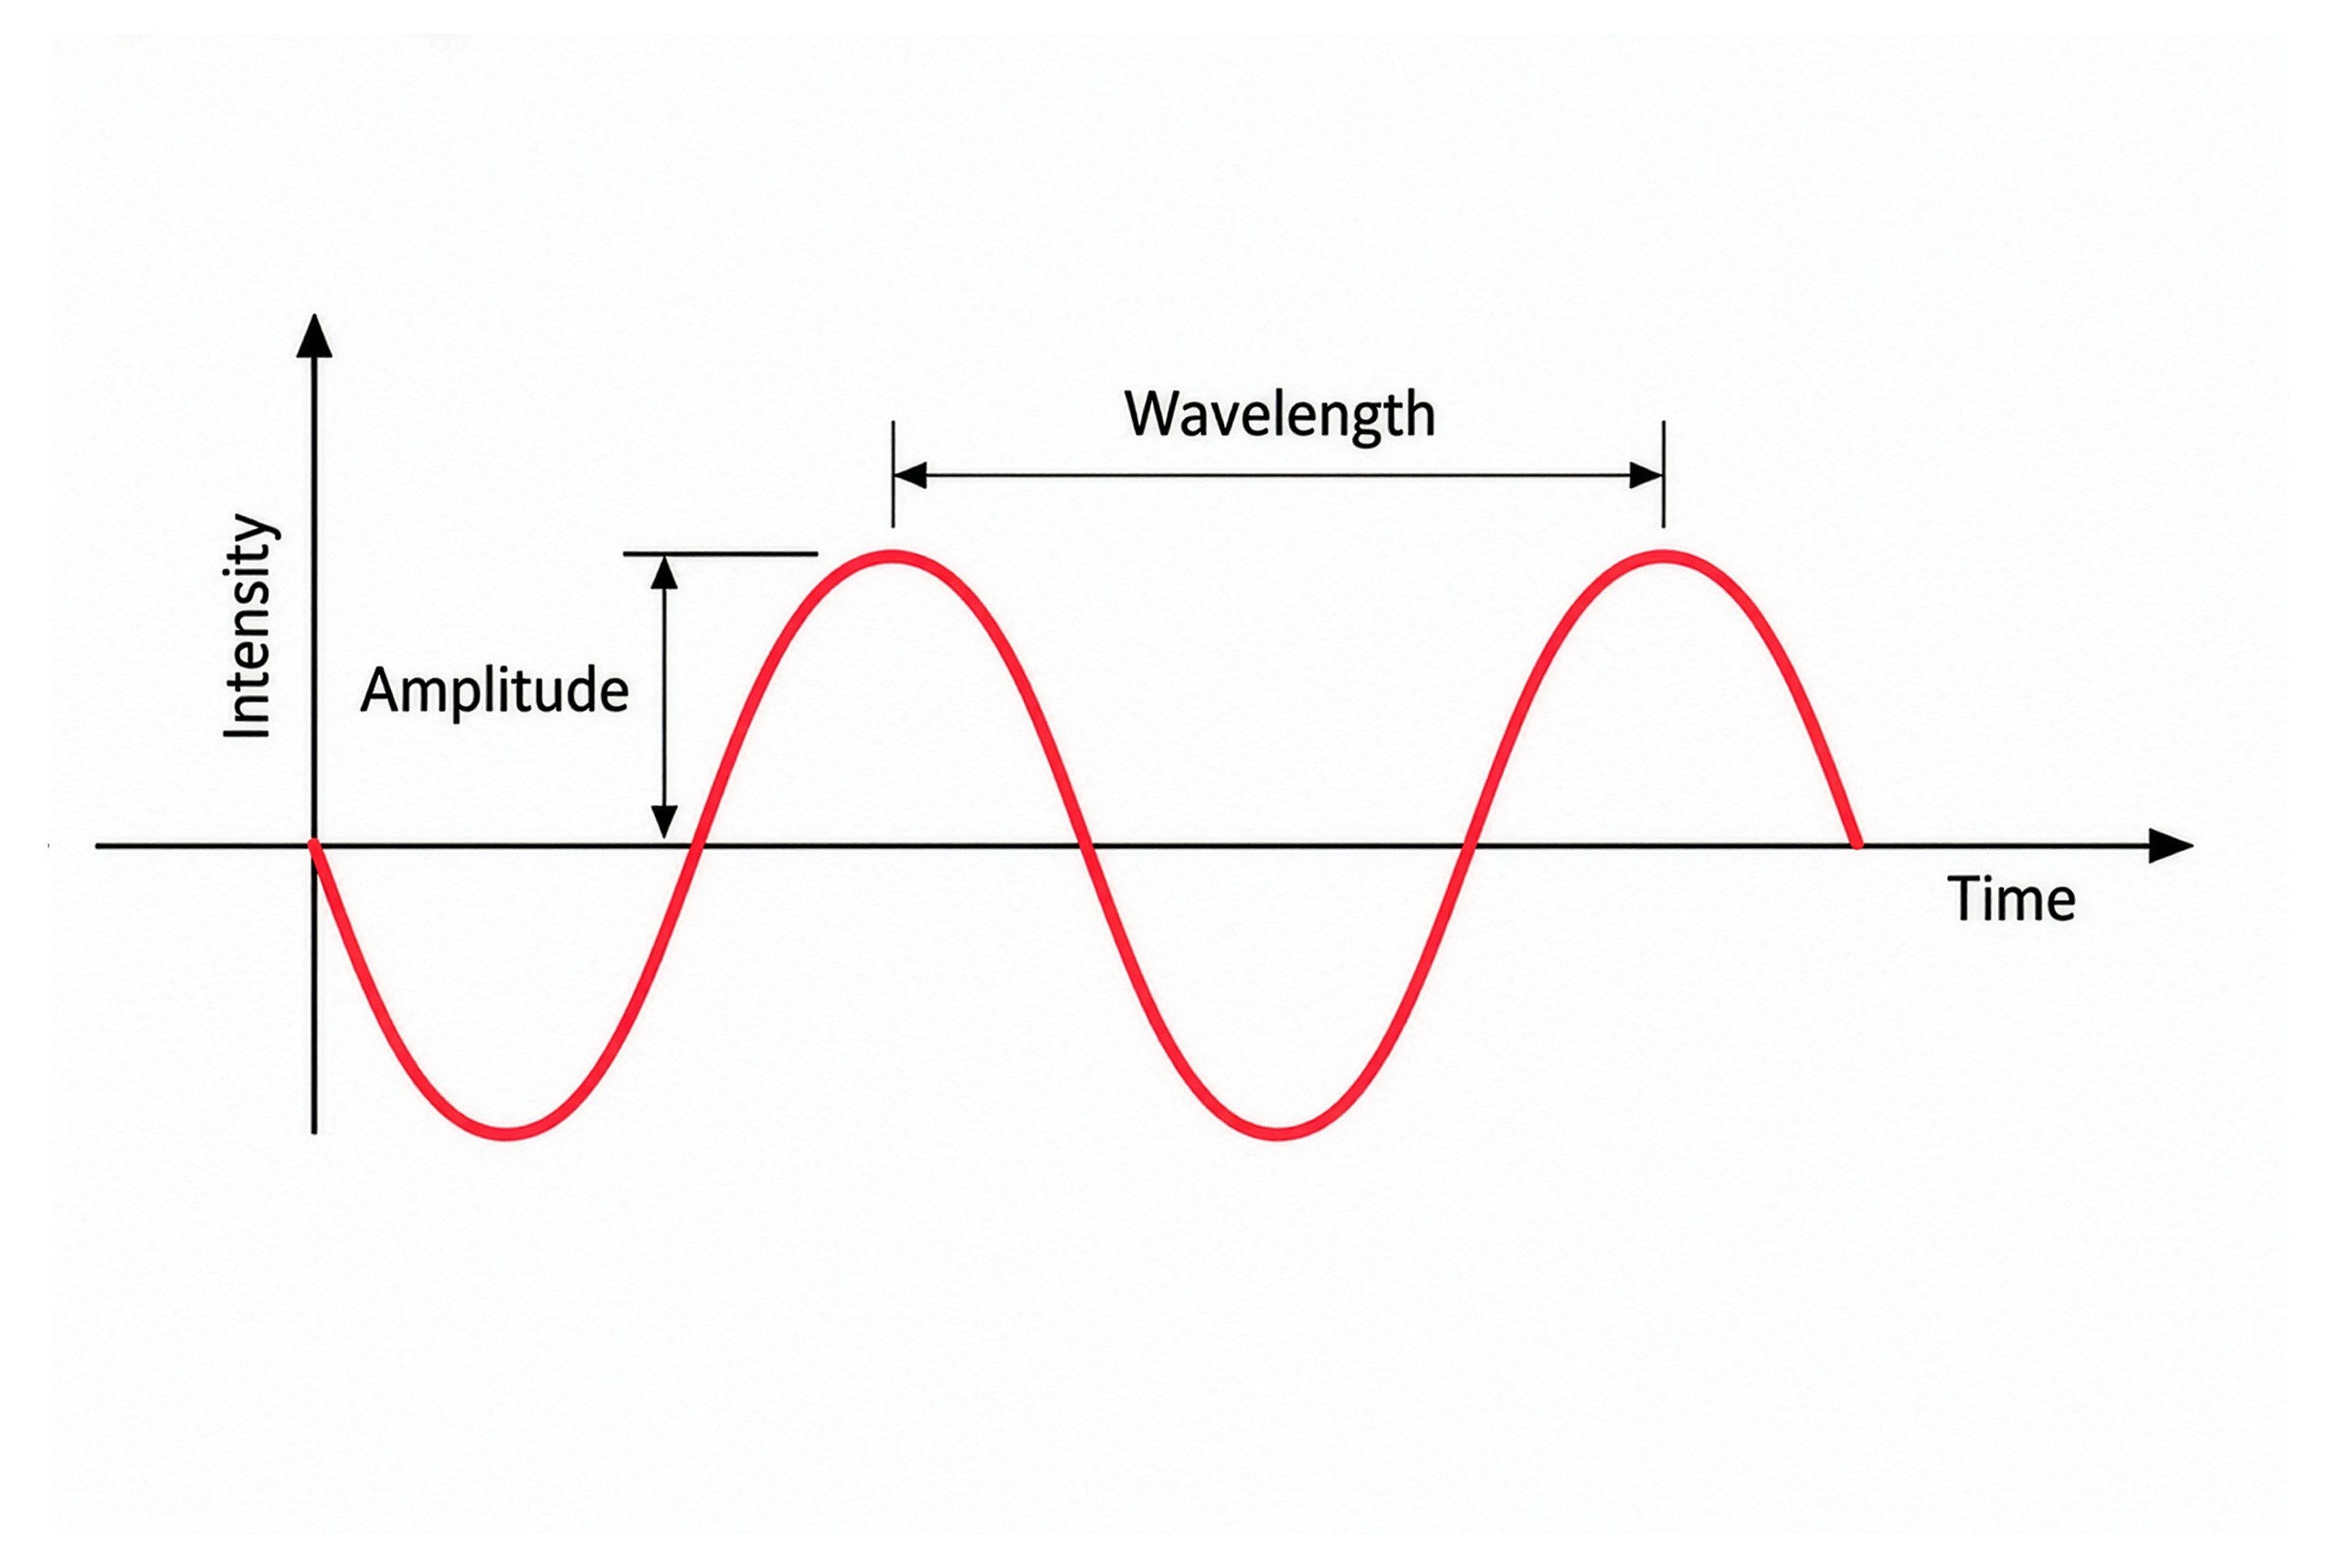
Fundamental Properties of Electromagnetic-Waves Amplitude and Wavelength
Visible Light and the Electromagnetic Spectrum: Physical Principles for Lighting Design How wavelengths influence perception, color, and light design After examining how the human eye adapts to different illumination levels…
Visual Signal Transmission Pathway in the Human Retina
Photopic vs Melanopic Illuminance: Definition and Spectral Sensitivity MEDI, EML, and CS. Three essential indicators for measuring the circadian impact of artificial light The perception of light varies according to…
Light Perception Human Eye Capabilities and Limitations
Light Perception: Capabilities and Limits of the Human Eye Understanding how the human eye works is the first step toward designing light with awareness  The human eye is a highly…
Lighting-Design-e-Teoria-della-Luce
Lighting Design and Light Theory Complexity in the relationship between light, perception, and design   How does a lighting designer develop a lighting project? Which disciplines should a rigorous lighting…
MENU